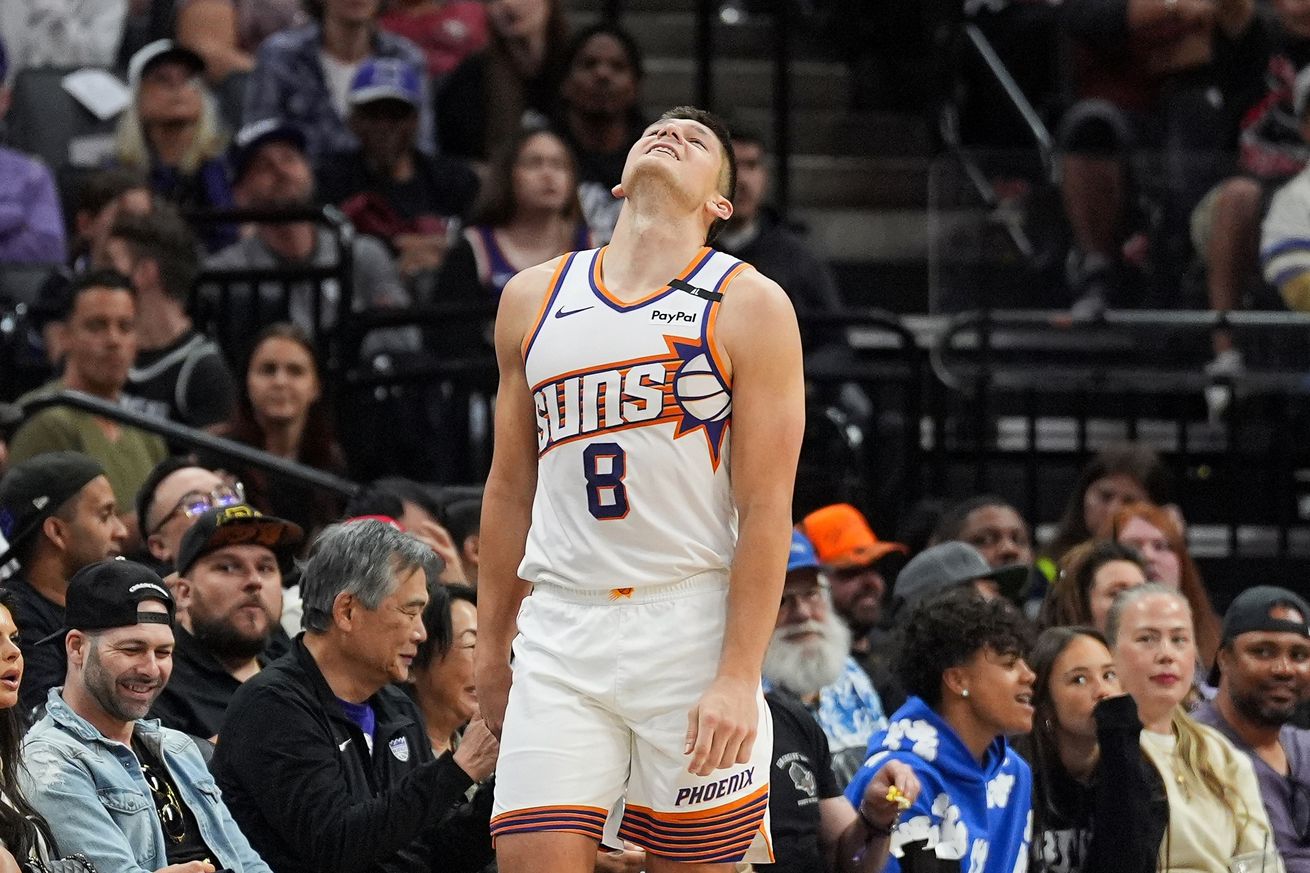
Behind the numbers lies the real reason the Suns fell apart.
The 2024-25 Phoenix Suns season has officially come to a close. Its moments are now part of our collective memory, its stats etched forever in the record books. And, of course, in the digital archives of Basketball Reference.
But how did we arrive at this point? What hidden narratives lie within the numbers, waiting to reveal the story of a team that never quite lived up to its potential? Let’s take a look at some of the not-so-obvious statistics that help illustrate the tale of a squad that fell short of fulfilling its destiny.
Winning Percentage: 43.9%
36-46. The final tally for Phoenix. A number that echoes through the franchise’s storied history, marking the fourth time they’ve reached this grim milestone and the first since the 2001-02 season.
It ties them for the 13th-worst winning percentage in the team’s history.

Number of Three-Pointers: 3,112
The Suns launched the three-ball at an unprecedented rate this season, setting a new franchise record with 3,112 attempts, surpassing the previous high of 2,674 set just last year. That’s a 16% increase in three-point attempts year-over-year.
The Suns launched 3,112 threes this season — the most in franchise history. That’s 438 more than the 2022-23 squad.
Let it fly, they said. Let it fly, they did.
— John Voita, III (@DarthVoita) April 14, 2025
And it wasn’t just quantity; they were effective, hitting 38.2% of their threes, ranking third in the NBA, and securing the 9th-best three-point percentage in franchise history. The Mike Budenholzer offensive philosophy (which didn’t work out too well for Coach Bud). The defense?
Number of 30+ Point Quarters Allowed: 152
The Suns played 334 quarters of basketball this season. In 152 of them — nearly half — their opponent scored 30 or more points. That’s 45.5% of the time. Ouch?
Facing the Suns meant you had a coin-flip’s chance of dropping 30 in a quarter. That’s at least 2.5 points per minute. For reference, 30 points in a quarter isn’t just a solid offensive showing, it’s a pace that signals collapse on the other end.
But it tracks. The Suns posted a defensive rating of 117.7, ranking them 27th in the league. That number isn’t just bad. It’s damning. It speaks to a team unable to contain dribble penetration, slow on closeouts, and allergic to defensive rebounds. It speaks to inconsistency in effort, a lack of cohesion, and a coaching staff unable to generate buy-in.
It speaks to a defense that, like much of this season, was simply not ready.
Beal’s Dollars-per-Point: $55,658.46
Bradley Beal’s contract, coupled with his ongoing availability issues, has become one of the Suns’ toughest pills to swallow. He played in 53 games this season, the same number he logged the year prior. If nothing else, he’s consistent.
Last season, Beal scored 964 points. This year? 902. And for those 902 points, the Suns paid him $50,203,930. That comes out to $55,658.46 per point.
How does that stack up next to his Big Three counterparts?
Kevin Durant scored 1,647 points on a salary of $51,179,021, meaning each of his points cost $31,074.09. Devin Booker led the team with 1,923 points on a $49,205,800 salary, translating to $25,588.04 per point.
Bradley Beal cost the Suns $55,658 per point this season.
Durant? $31,074 per point. Booker? $25,588 per point.
Beal played 53 games—same as last year—and scored fewer points. High price. Low return. pic.twitter.com/zH1Iifqg0x
— John Voita, III (@DarthVoita) April 14, 2025
So yes, this is another way to look at Bradley Beal’s price tag, through a dollars-per-point lens. And no matter how you slice it, the return on investment simply isn’t there. While Booker and Durant shouldered the scoring load at a relatively better value, Beal’s output was the most expensive by far.
It underscores the deeper issue: Beal isn’t just overpaid—he’s underdelivering. And in a league driven by production, that’s a dangerous combination for a team with no flexibility and championship ambitions hanging in the balance.
Different Starting Lineups: 35
The Suns trotted out 35 different starting lineups over the course of just 82 games—a telling reflection of a team in constant flux. Searching for chemistry, chasing health, and grasping for rhythm, the lineup card was more a roulette wheel than a foundation.
Their most consistent group — Tyus Jones, Bradley Beal, Devin Booker, Kevin Durant, and Jusuf Nurkic — managed to share the floor for just 10 games. They went 7-3 in that stretch, a fleeting glimpse of what might have been if stability ever had a chance to take root.
Which NBA team used the most different starting lineups this season? pic.twitter.com/T83gXZflqP
— John Voita, III (@DarthVoita) April 14, 2025
Which of these stats catches you off guard? Which one feels like the inevitable truth behind a lost season? And which leaves you staring at the ceiling, wondering what could’ve been? Drop your thoughts in the comments.
We’re listening.
Listen to the latest podcast episode of the Suns JAM Session Podcast below. Stay up to date on every episode, subscribe to the pod on Apple, Spotify, YouTube, YouTube Podcasts, Amazon Music, Podbean, Castbox.
Please subscribe, rate, and review.