Baserunners and RBIs.
Introduction.
After two seasons of near league-average in runs scored, last season the Diamondbacks scored more runs than any other team. What happened?
Bottom line up front; three things happened. They had more baserunners (two standard deviations more), a higher percentage of their baserunners scored by homers, and a higher percentage of their baserunners scored by non-homer RBIs.
Let’s look at what happened.
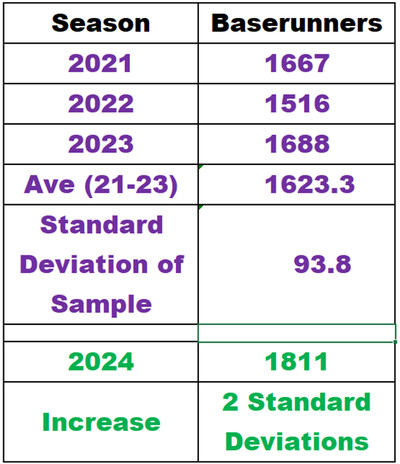
In 2024, there were more baserunners.
The following table shows that there were about 1811 baserunners. Caveat: It was calculated with rounded data, so that number could be plus or minus 26 baserunners. Also, it shows that last season had more baserunners by two standard deviations (which is meaningful because that much increase is unlikely to happen randomly!).

Diamondbacks. Data from Baseball Reference.
Did more baserunners entirely explain why the Diamondbacks led the league in runs scored?
Not by a long shot. Let’s look at baserunners who scored by runs batted in (RBIs). Compared to the three previous seasons, two amazing things happened.
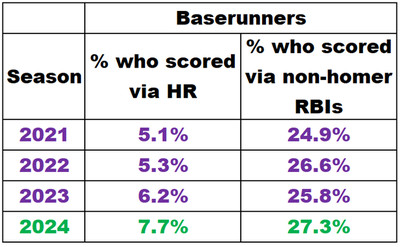
The following table shows:
- A higher percentage of baserunners scored because home runs. Those runs-scored exclude the batters who hit the home runs.
- A higher percentage of baserunners scored because non-home runs. Those RBIs include singles, doubles, triples, bases-loaded walks, bases-loaded hit-by-pitches, and single-outs while runner(s) score.

Diamondbacks. Data from Baseball Reference.
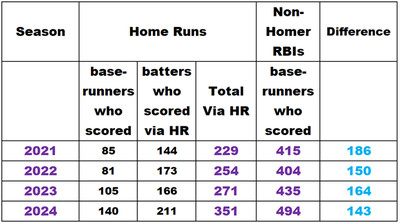
More runs happened by non-homer RBIs, but the difference shrunk 23% compared to 2021.
The following table shows that home runs have consistently accounted for less than half the team’s runs scored. Last season, the difference between runs scored because of home runs and runs scored because non-homer RBIs shrunk 23% to 143 runs. Details are in the following table.

Diamondbacks. Data from Baseball Reference.
Runs were scored in other ways.
Home runs and non-homer RBIs don’t account for all runs scored by the Diamondbacks. The other ways to score runs are errors, wild pitches, passed balls, balks, and grounded into double plays. When those events cause a run to score, it is not an RBI. This type of run happened between 35 and 44 times each season. The following list shows how often these types of runs scored.
- 2021, 35 runs.
- 2022, 44 runs.
- 2023, 40 runs.
- 2024, 41 runs.
What is the outlook for 2025?
The biggest question is, “Can the Diamondbacks again reach 1811 baserunners?” If not, despite great hitting, RBIs and runs scored will likely fall.
Another concern is that the Diamondbacks lost two players who hit a total of 148 RBIs. They lost Christian Walker (84 RBIs last season) and Joc Pederson (64 RBIs last season). Those losses could negatively impact runs scored.
On the plus side of the equation, the Diamondbacks gained Josh Naylor, who hit 108 RBIs last season. That makes up for 73% of the loss! (A caveat is that his actual performance could vary). And it is entirely possible that extra PAs in the DH position (instead of PAs by Joc Pederson) by players with good match-ups will make up the remaining difference!
My view is that it is possible (but with considerable uncertainty) that the Diamondbacks will remain near the top of the Majors in runs scored.
Summary.
The Diamondbacks had two standard deviations more baserunners.
A higher percentage of their baserunners scored by homers.
A higher percentage of their baserunners scored by non-homer RBIs.
More runs happened by non-homer RBIs, but the difference shrunk 23% compared to 2021.
Between 35 and 44 runs per season are scored because of errors, wild pitches, passed balls, balks, and grounding into double plays.
If the Diamondbacks again reach 1811 baserunners, if they continue to score high percentages of baserunners, and if newly acquired Josh Naylor again hits 108 RBIs, then it is possible that the Diamondbacks will remain near the top of the league in runs scored.