Downside possibility was visible after 8 games.
Inspiration.
My pitching prediction and my win prediction were that Diamondbacks pitching would be near league average, as measured by runs allowed. Although I am sticking with that prediction, perhaps there is more downside than upside in my prediction. Let’s look!
The first 8 games provided emerging insights.
Looking at the first 8 Diamondbacks’ games (very early in the season), what are some emerging pitching insights?
On the positive side, the Diamondbacks were one of the best three teams in allowing a low percentage of hard-hits (third best team in the Majors). Also, their strikeouts per walk was well above average. These team stats are shown in the following table.
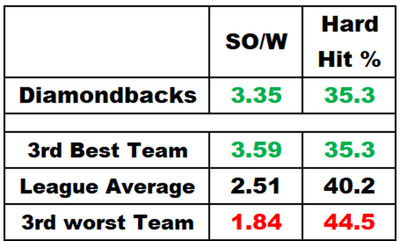
Games through 4 April (8 Diamondbacks games). Data from Baseball Reference and Baseball Savant.
In the long run, these two strengths should result in runs allowed that is lower than the league average. After 8 games, the Diamondbacks 5.25 runs allowed per game was higher than the 4.33 league average. Only six teams allowed more runs per game. I’m puzzled.
What explains a high number of runs allowed by the Diamondbacks?
Home Runs. The Diamondbacks’ home runs allowed per 9 innings was the second highest in the Majors (behind the Brewers). My first incredulous thought was that despite allowing the third lowest percentage of hard hits, they allowed the second most home runs per 9 innings. What explains the seeming inconsistency in these two statistics?
Perhaps opponent batters swung for the fences, not caring whether they struck out. When considering the Diamondbacks’ above-average strikeouts-per-9-innings and above-average strikeouts-per-walk, that is a reasonable explanation.
Perhaps more home runs happened because torpedo bats. One fact countering that idea is that the Diamondbacks won their series against the Yankees, who prior to that series had hit a lot of home runs, many with torpedo bats. My view is that good pitching prevents home runs, even against torpedo bats.
In case you want to see it in a table, the following table compares the Diamondbacks’ HR9 and the hard-hit percentage to other teams.
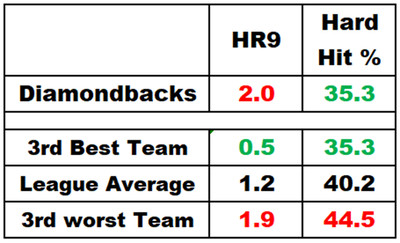
Games through 4 April (8 Diamondbacks games). Data from Baseball Reference and Baseball Savant.
In an attempt to find deeper insights, let’s look at HR9 and hard-hit percentages for individual Diamondbacks’ pitchers. This time, let’s first look at the table.
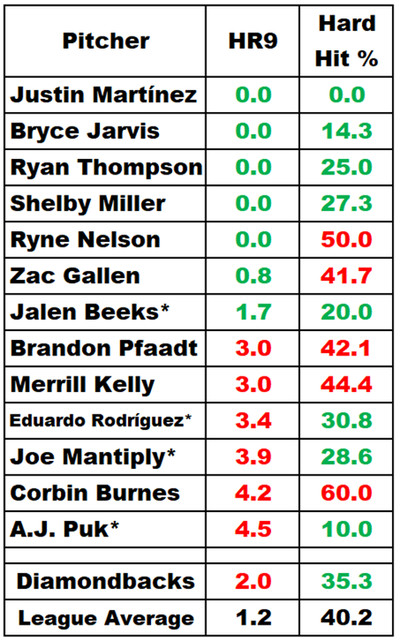
Games through 4 April (8 Diamondbacks games). Data from Baseball Reference and Baseball Savant.
Pitchers whose HR9 does not seem to match their hard-hit percentage include starters Gallen and Rodriguez, and relievers Nelson, Mantiply, and Puk. Gallen’s hard hit percentage was near league average, and he has one of the lowest hits per 9 innings on the team, so I’m not worried about his HR9. Rodriguez has a better than average hard-hit percentage, so I’m confident his HR9 will improve. Often, reliever stats can vary temporarily, so I’m not yet worried about the relievers.
Corbin Burnes HR9 and hard hit percentage are the result of one game. I’m very confident that his statistics will improve dramatically.
Update: In the tenth game Corbin Burnes pitched 5 innings without allowing a home run. That lowered his HR9 from 4.2 to 1.9, and lowered his hard-hit percentage from 60% to 50%.
I’m confident that the Diamondbacks will not finish the season with one of the league’s worst HR9s.
Bad Luck. Perhaps pitchers were unlucky.
One measure of bad luck (or at least unsustainability) is very high HR/FB. Five Diamondbacks pitchers had a HR/FB of .330 or higher. Their high HR/FBs was truly unlucky. Only one of those five pitchers had more than 5.1 innings pitched.
Update: In the ninth game Eduardo Rodriguez pitched 5 innings without allowing a home run. That lowered his HR9 from 3.4 to 1.7, and lowered his HR/FB from .330 to .250.
A second measure of bad luck (or at least unsustainability) is BABIP. Three pitchers (Martinez, Jarvis, and Nelson) had BABIPs of .333, .429, and .571.
A third measure of bad luck is xFIP vs ERA. The Diamondbacks had some rare fielding snafu’s in their first 8 games, which impacted ERA more than FIP. Ten out of 13 Diamondbacks pitchers had ERAs greater than their xFIPs. The largest differences between ERA and xFIP were unbelievable: 8.3 (Joe Mantiply), 6.63 (Ryne Nelson), and 5.85 (Bryce Jarvis).
Bad luck will likely be temporary. Going forward, the Diamondbacks’ luck will improve.
The Diamondbacks Played Excellent Teams. Through 4 April, the Diamondbacks played 4 games vs the Cubs, 3 games vs the Yankees, and one game vs the Nationals.
The Diamondbacks did indeed play excellent teams:
- 7 of the 8 games were against teams with winning records.
- FanGraphs predicts at the end of the season the Cubs will have 84 wins, and the Yankees will have 87 wins.
- A recent power rankings ranked the Yankees the second best team in the Majors.
Summary.
I predicted that Diamondbacks pitching would be near league average, as measured by runs allowed.
A positive emerging insights after 8 games was that the Diamondbacks were one of the best three teams in allowing a low percentage of hard-hits, and their strikeouts per walk was well above average.
Despite the positive insights, what explains a high number of runs allowed by the Diamondbacks?
- Home runs. The Diamondbacks’ home runs allowed per 9 innings was the second highest in the Majors. I’m confident this statistic will improve.
- Bad luck. Three measures (HR/FB, BABIP, and ERA-xFIP) show the Diamondbacks experienced bad luck. Their luck will likely improve.
- The Diamondbacks played excellent teams. 7 of the 8 games were against teams with winning records, who are projected to finish the season with winning records.