The big-budget teams were back with a vengeance this year
Back in December, the Dodgers signed Shohei Ohtani, while fudging the numbers so that he was paid less than Scott McGough in 2024. A lot of people, including myself, weren’t happy about it, and I wrote about my concerns. After setting a new record with the biggest contract in baseball history with the $700 million given to Ohtani, the Dodgers kept right on spending, They set a new record with the biggest contract in baseball history for a pitcher, Yoshinobu Yamamoto getting a $325 million deal (not including the $50 million posting fee). Add Tyler Glasnow ($136.5m), Will Smith ($140m) and others: by the time Opening Day came around, Los Angeles had spent about $1.4 billion dollars over the winter.
For comparison, Forbes estimated the entire value of the Diamondbacks’ franchise in March to be $1.425 billion, so about a Jordan Montgomery more than the Dodgers shelled out in a few months last off-season. I questioned whether competitive balance could be sustained in the wake of such a financial blitz, and things unfolded largely as I predicted once the season started. Despite a withering series of injuries, which factored into their lowest win percentage since 2018, the Dodgers rolled to yet another division title. They were never out of first place at any point. Despite the Padres flattering to deceive, it really wasn’t that close, Los Angeles finishing five games clear.
If a success was ever bought, it was by the 2024 Los Angeles Dodgers. Of their Top 10 position players by bWAR in 2024, six were free agents, two were traded for, and only two were drafted by Los Angeles. Contrast the 2023 NL pennant winning D-backs: in our top ten, there were five draftees or amateur free agents, a waiver pick, two tradees, and just two free agents (Even Longoria and Lourdes Gurriel Jr). That pair earned less then $10 million and were worth only 3.5 bWAR. Those six Dodgers’ FA’s in 2024? $65 million, not including whatever shady Hollywood accounting figure you want to come up with for Ohtani, and provided close to twenty-four wins.
Things are unlikely to get any better. In this week’s round table, Wes brought up how the Dodgers are now, de facto, Japan’s team. Despite a smaller population and a 9 am start, more people watched World Series Game 2 in Japan than the US. As the most obvious pipeline of major-league ready players, Los Angeles and their open checkbook will be the first place players will check in, as we saw with the near-sham process executed by Ohtani (really, was there ever any doubt?). Pretty much, the Dodgers want an NPB player, they’ll get them. This is not good news for competitive balance in the National League West. Genuine question: how can the D-backs compete, on revenue barely half that of the Dodgers?
I thought it would be interesting to see what kind of a correlation is between wealth and success, at least in the regular season. I’ve used the figures from Forbes – which I admit are imperfect, but their best neutral source we have for all 30 teams. The chart below shows for each team, the franchise value (in billions), 2024 revenue (millions) and 2024 operating income (basically profit/loss, also in millions), and the team’s W% over the four full seasons since COVID (2021-24). I’ve sorted it by descending order of revenue, because as we’ll see, that turns out to have the highest correlation to success on the field.
First things first. Operating Income is irrelevant, with a correlation of a feeble -0.002. I think it’s likely to vary too much year-to-year to have much predictive value. Somewhat related: how the hell are the Mets and Padres both losing more than a hundred million dollars in one year? I get that both over-extended themselves in an effort to buy success, and are spending in excess of their income. But, still: wow. The detailed breakdown for the Mets gives them revenue of $393 million, and player expenses alone of $374 million. So, all but nineteen million dollars of their revenue went on payroll. That doesn’t seem sustainable. The Padres aren’t much better, with figures of $345m/$288m respectively.
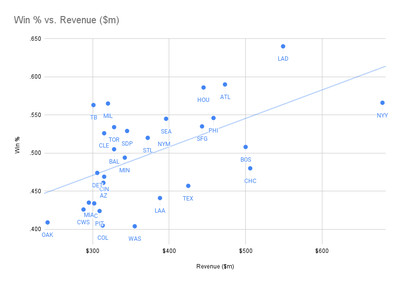
It’s when we look at franchise value and revenue that things get interesting. Value and win percentage have a correlation of 0.489, and revenue is even higher, at .570. It’s not a surprise, of course, but it’s nice to have data which back up the instinct. More money means, not only can you buy better free-agents, it gives you greater flexibility in the event of a flop. Contrast the way the Jordan Montgomery situation will limit the D-backs’ options this winter. Below, is a scatter chart plotting revenue against win percentage, with a trend line. If you’re above that line, you’re getting more “bang for your revenue” than expected; below it is doing worse.

Arizona comes in just under the line, but that’s largely due to the horrendous 2021 campaign. This have, obviously, been a lot better since, and hopefully it’s something which can be sustained going forward. Given our revenue, I’d like to see us up there with the like of Rays and Brewers, averaging .550 or thereabouts, which is basically this year’s 89-win pace. In MOST seasons, that would get you a spot in the playoffs, I feel. But the harsh reality is, given the D-backs revenue, you’d expect a win percentage of only .475 or thereabouts. Given the limited options in terms of increasing their income stream, especially in a cord-cutting world, they will need to punch above their weight. Spend smarter, not harder.
Into the playoffs
The “saving grace” is the post-season system. What you do over the first 162 games becomes almost irrelevant in the playoffs. Everyone starts 0-0, and it becomes a sprint, not a marathon. The team which plays best in October wins, and baseball is a game where it’s possible for any franchise to have a good month. Even the Rockies, the worst team in the National League, had a winning record in May. This is likely the only thing standing between baseball and a situation like the English Premier League, where just four teams (two from London, two from Manchester) have won 27 of the last 29 titles. Or, worse, the Scottish Premier League where the last time someone outside Celtic and Rangers won was 1985.
Now, you could argue that this situation doesn’t hurt those sports, or the appeal they have to fans of football there. But it’s also true that expectations are different there. In American sports, to quote the great philosopher Rickie Bobby, “If you ain’t first, you’re last.” Think Yankees fans are happy right now to be second-best? But in the EPL, second through fourth comes with benefits, in particular earning a spot, without the need to qualify, in the highly lucrative European Champions League. The presence of relegation to a lower tier for the worst teams is also a factor: fans are often happy just to avoid that fate. But enough of things across the pond.
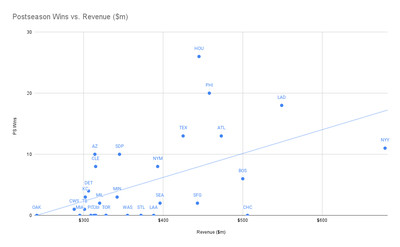
It’s difficult to know how to quantify post-season success across years. In the end, I kept it simple and went with post-season wins in the same period, 2021-24. I understand this has limitations, not least that not all wins are equal. But figuring out a weighting system to take that into account feels like a lot of trouble, for a dubious increase in result accuracy. So wins it was, from the Astros (averaging 6.5 post-season victories per year) down to the eleven teams not to have won a play-off game in the post-COVID era. We continue to see a solid correlation between wealth and post-season victories: value dropped to 0.371, but revenue was still up at 0.532, only slightly lower than for regular season wins.
uere’s the graph, pitting 2024 revenue against just playoff wins over the previous four years of play. The clustering of teams without any post-season success does make this graph a little more difficult to read. But of them, you can see that only the Cubs – their last playoff victory coming back in 2017 – rank in the top ten for revenue. There is logic to this. If you don’t win many regular season games, you’re not going to get the chance to win any post-season contests. Unsurprisingly, there is a high correlation (0.585) between the number of regular and post-season victories, so I have a feeling this is almost a self-fulfilling prophecy.

To work around that, I also looked at win percentage in the post-season. I eliminated the seven teams not to have made the playoffs in the past four years. Across the other 23 teams. the W% ranged from the Rangers (13-4) to the Blue Jays, Cardinals, Orioles and Marlins, who had all made the post-season, but not won a game. The correlation to revenue there was weaker, at .372. But there, it didn’t seem fair to equally weight Miami’s two playoff games and Houston’s 42. So, I ranked the 23 playoff teams by revenue and grouped them into thirds. The top eight richest teams went 109-85 in the post-season; the middle seven went 23-29; and the poorest eight were 29-41.
This does seem to suggest that the benefits of wealth do stretch into the playoffs. Though interesting the bottom tier not only played more post-season games than the middle one, they also had a better win percentage. This may be just random noise. I did the same thing for regular season results: the top third there, average revenue $487m, has a W% of .545, the middle third (ave. revenue $349m) came in at almost even (.499), and the bottom tier ($298m) were at .456. In a five- or seven-game series, chaotic factors have a much greater chance to impact a contest, and anything can happen. However, it looks like the playoffs mirror life in general, and the rich will always have an edge.
